Mapping Light Polarization in the Sky

Polarized light defines the transverse electromagnetic waves of light that oscillate perpendicularly to one another. This property of light occurs when light is reflected off a surface, especially a semi-transparent one, as the surface reorients the waves to oscillate perpendicularly. The atoms or molecules of the surface temporarily absorb and then re-emit the light. Linearly polarized light oscillates only on one axis. In the atmosphere this is caused by waves of light interacting with small particles such as water that polarize the light along the axis.
A linear polarizer is a sheet of glass or plastic with very thin lines running in one direction. These lines filter cut any ray of light that is polarized opposite to the orientation of the filter while letting other rays through. The resulting rays are linearly polarized in the direction of the filter. By using a linear polarizer, we can cut any linearly polarized rays that oscillate oppositely to the filter.
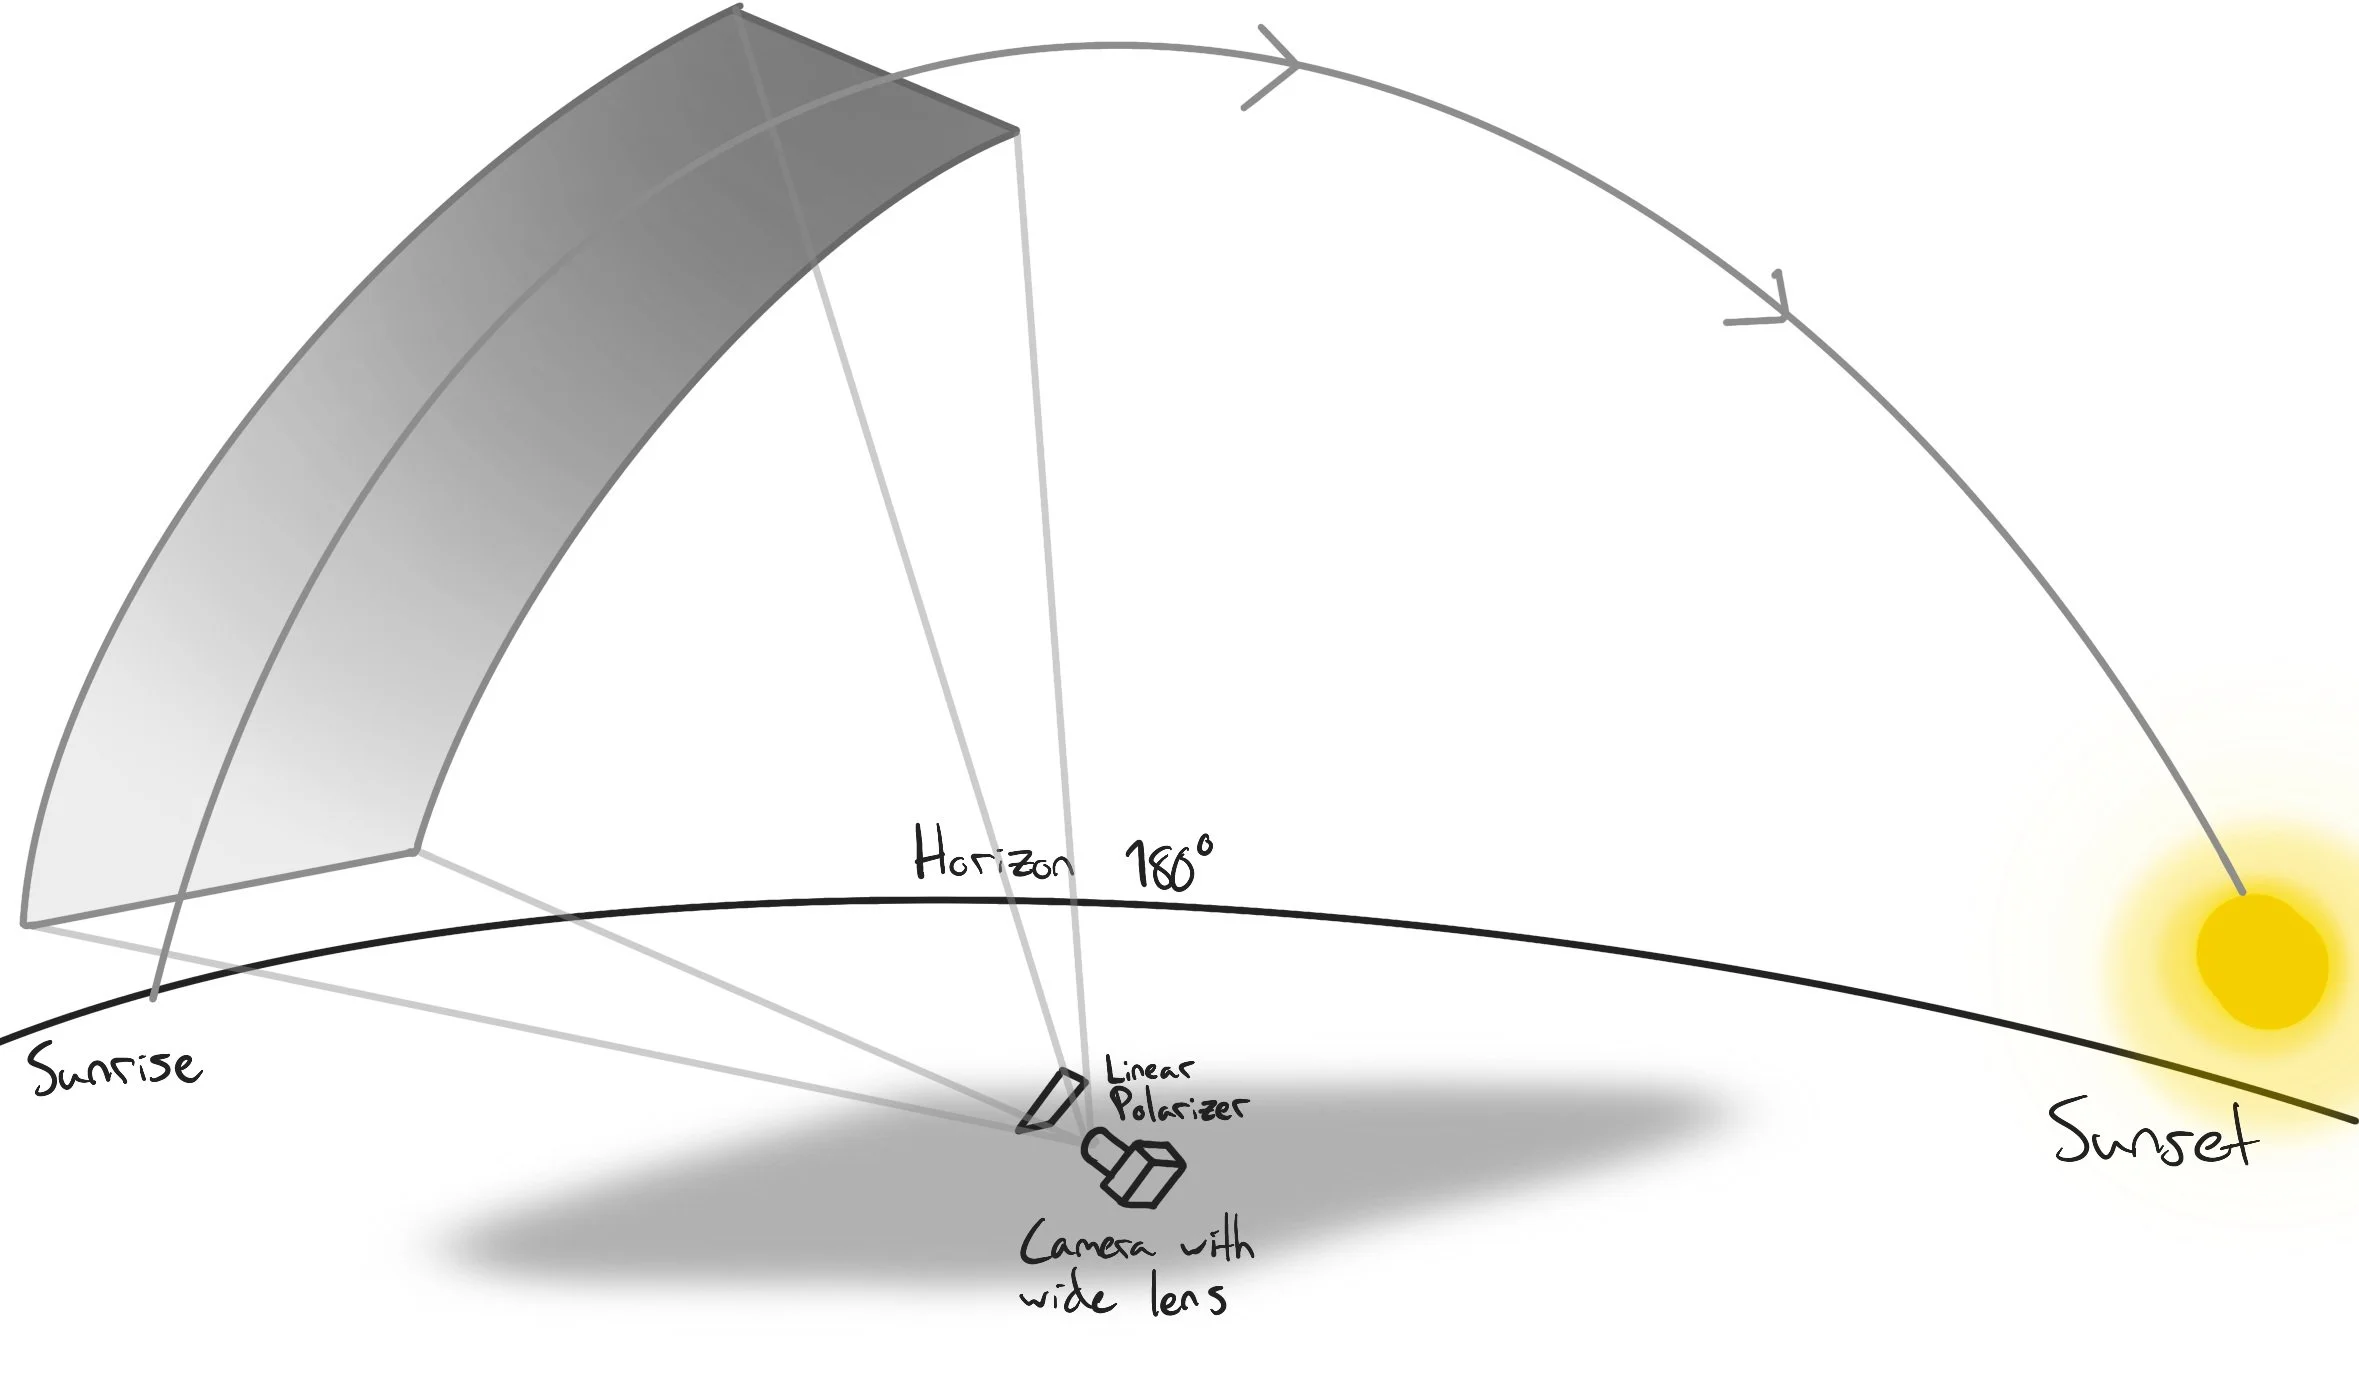
The polarization of the sky has been mapped already with something called the Rayleigh sky model. It indicates that polarization is highest at a 90-degree angle to the sun and anti-sun. The goal of this experiment is to replicate the Rayleigh sky model on a sunny day and observe the factors that may obstruct accurate measurement. I anticipated atmospheric interference, which is why I took the photos on the clearest day possible.
With this information I set out to measure skylight polarization during a clear day. I obtained a large sheet of linear polarizer material to use in the experiment. I also used a mirrorless digital camera on a 24mm lens to capture a large portion of the sky. The 24mm lens captures an angular field of view of 73.7 degrees vertically, which I then cropped to 57.23 degrees. The aperture and shutter speed were the same for all photos, and the ISO was set to 100. I took three sets of photos at different orientations to the sun. For each position I took a photo without the polarizer and a photo with the polarizer angled to cut the maximum amount of light, which was usually around 65 degrees rotated. The sun was low in the sky at this time of day, so I expect to see change in both the horizontal and vertical dimensions.


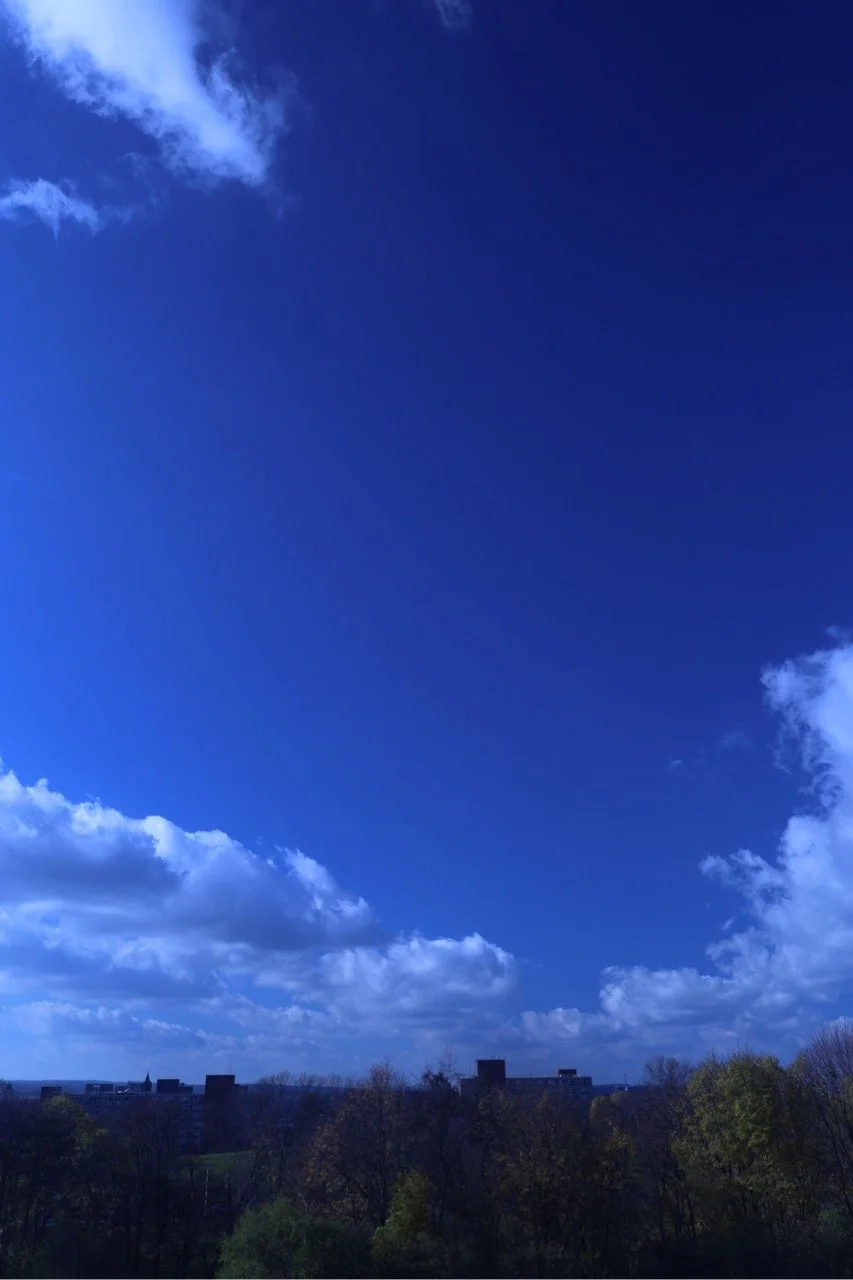
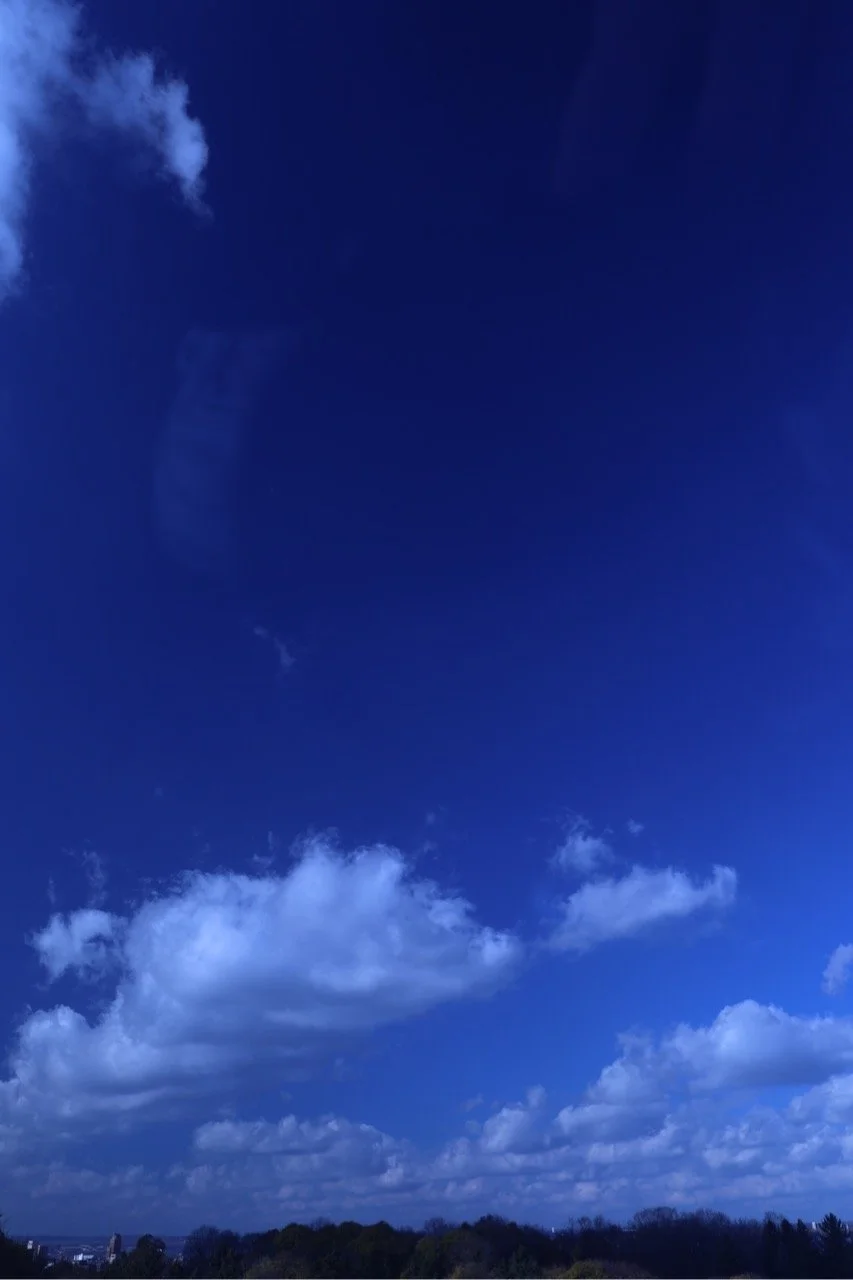
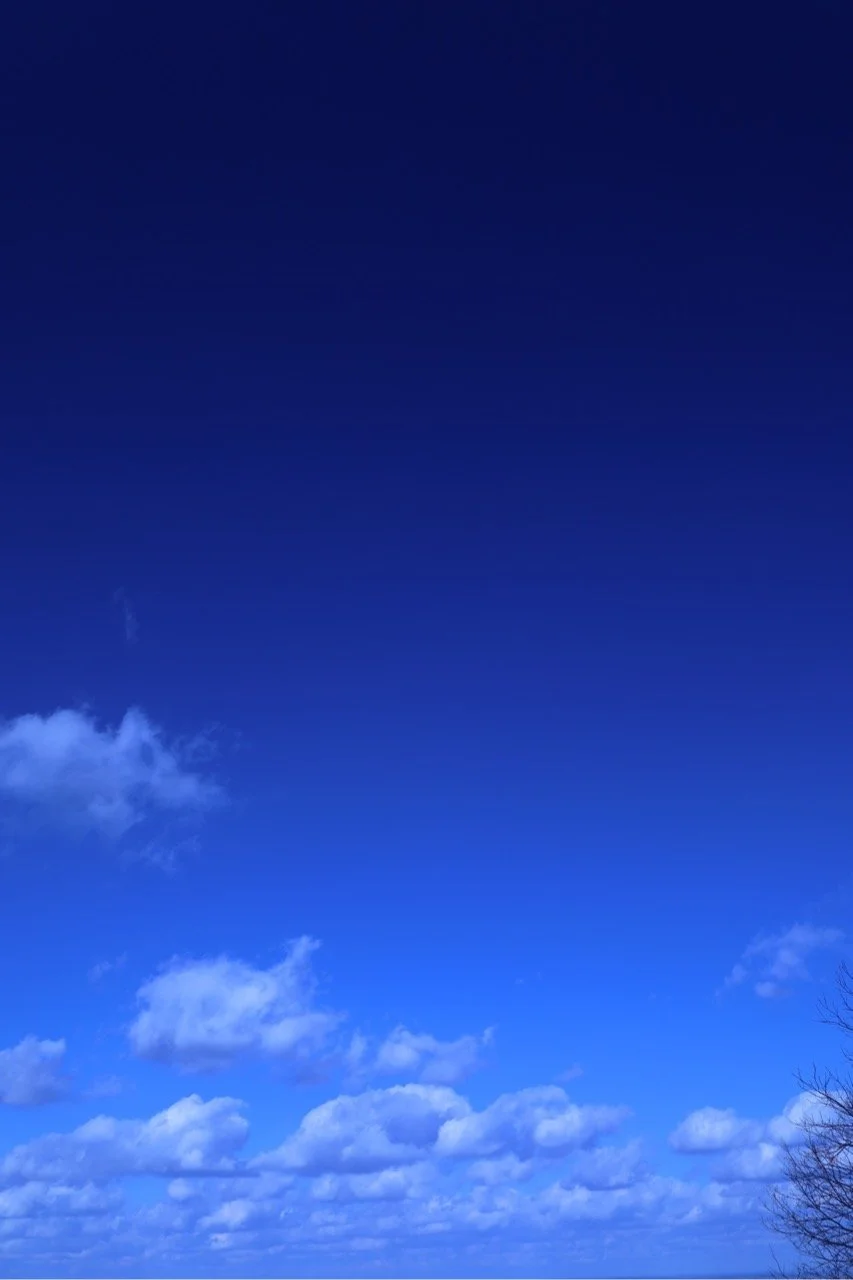
From the three photos with the polarizer above you can roughly make out a dome shape where the sky is darkest aka most polarized. I then graphed the images horizontally and vertically in ImageJ, but found the vertical dimension to show more change.
Below are the graphs comparing the brightness of the image with and without the polarizer, top to bottom. The expectation is that more light is cut by the polarizer in orientations closer to perpendicular to the sun, such as photo 1 and 2. Though the slopes of the graphs appear relatively similar, their ratios at the start and end point change, thus changing their relationship. *CLICK FOR INFORMATION*


From these measurements we find that Photo 1 shows the greatest amount of change in its ratios, suggesting Photo 1 has the highest change in polarization from top to bottom. This is concurrent with the Rayleigh sky model, as Photo 1 was taken on the edge of the band where polarization becomes most intense.
Since all photos were taken with the same settings, they can be cross referenced to find some interesting results. Photo 2 has the lowest gray value under the polarizer at 31, meaning there is the most polarization at the top of Photo 2. This confirms the assumption that Photo 2 would show the most polarization because it is taken at 90 degrees to the sun which is the most polarized part of the sky. Photo 3 also has the highest gray value under the polarizer for the bottom of the sky, meaning the lower part of the sky opposite the sun is the least polarized. There is also a more positive slope on the bottom graph of Photo 3, suggesting a less severe change in polarization throughout.
Conclusion
I faced unexpected challenges while performing this experiment. I realized that the accuracy of my measurements requires more sample sizes with more consistent weather conditions. I had some clouds that interfered with measurements. Overall, my findings do match up with the existing knowledge about polarized light in the sky, which affirms my method of experimenting. I was initially disappointed with my findings because the slope of the exposure values remained consistent; however, I did not think to compare the ratios. Once I took this approach I found my results were consistent with the accepted model.
Further experimentation could include a more panoramic view of the sky to cover the full 180 degrees from the sun to the anti-sun. This would allow more consistent measurement across the whole sky. If I could perform it again, I would have measured more accurately the direction which photo was taken in and take many more photos from other angles. It might have also been helpful to map photos horizontally as well. For this experiment, exposure was mapped with one dimensional lines, limiting the amount of data able to be collected. If a system could be devised where the images were analyzed in two dimensions, one could accurately compare changes in polarization within and across images.
Works Cited
Fore, Meredith. “Polarization Of Light: Definition, Reflection, Refraction & Scattering.” Sciencing, 5 Dec. 2019, https://www.sciencing.com/polarization-of-light-definition-reflection-refraction-scattering-13722360/.
Karman, Salmah B., et al. “Bio-Inspired Polarized Skylight-Based Navigation Sensors: A Review.” Sensors (Basel, Switzerland), vol. 12, no. 11, Oct. 2012, pp. 14232–61. PubMed Central, https://doi.org/10.3390/s121114232.
Lux | Light Measurement, Photometry & Illumination | Britannica. https://www.britannica.com/science/lux.
Manion, Garrett N., and Thomas J. Stokkermans. “Polarization of Light.” StatPearls, StatPearls Publishing, 2024. PubMed, http://www.ncbi.nlm.nih.gov/books/NBK592424/.
Polarization of Light. Directed by GetAClass - Physics, 2021. YouTube, https://www.youtube.com/watch?v=I-mJp4TnGXw.
Physics Tutorial: Polarization. https://www.physicsclassroom.com/class/light/lesson-1/polarization.
Rayleigh Sky Model - Wikipedia. https://en.wikipedia.org/wiki/Rayleigh_sky_model.
Wang, Yujie, et al. “Design of a Device for Sky Light Polarization Measurements.” Sensors (Basel, Switzerland), vol. 14, no. 8, Aug. 2014, pp. 14916–31. PubMed Central, https://doi.org/10.3390/s140814916.